Usage
Access Rights
User must be included in the group “Accounting / Advisers” to have access to MIS Builder.
Standard financial MIS Builder menus are located in:
- Accounting > Report > MIS Builder
- Accounting > Report > Configuration > MIS Builder
Distinction between Templates and Instances
MIS Reports are based on KPI (Sales, Cost, etc.) that needs to be displayed in certain Periods (2018, March, etc.) for certain Data (Actual, Budget, etc.):
- KPI are defined in the “MIS Report templates”
- Periods are defined in the MIS Reports”
- Actual Data are coming by default from the standard Odoo Accounting Moves
- Budget Data are defined in the “MIS Budgets”
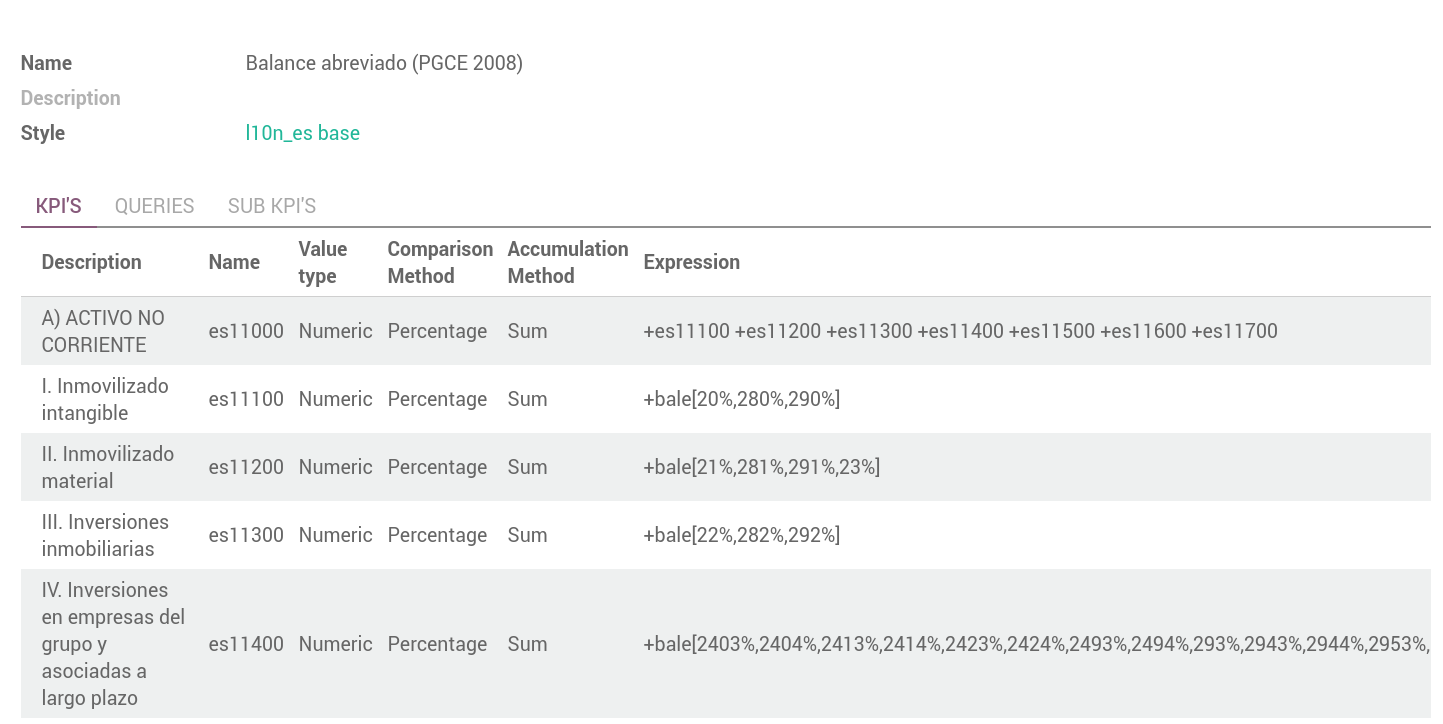
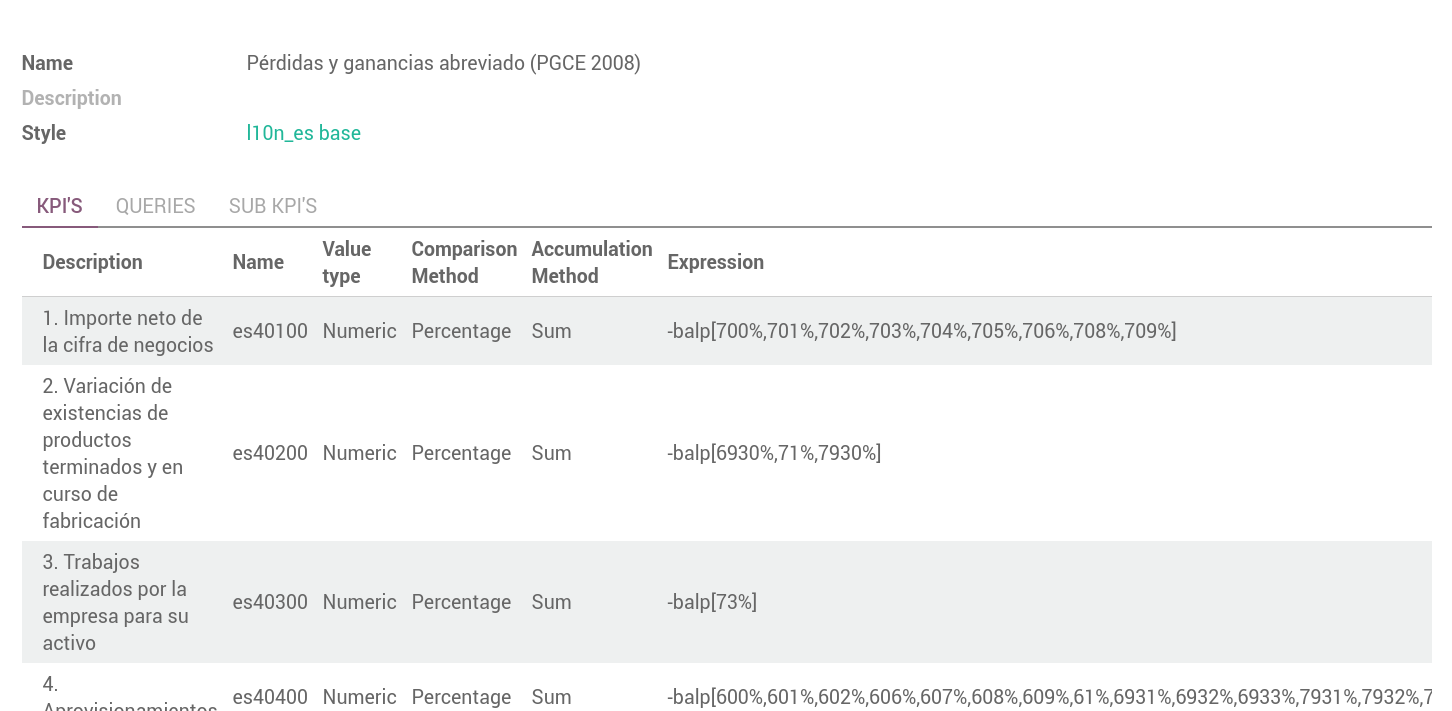
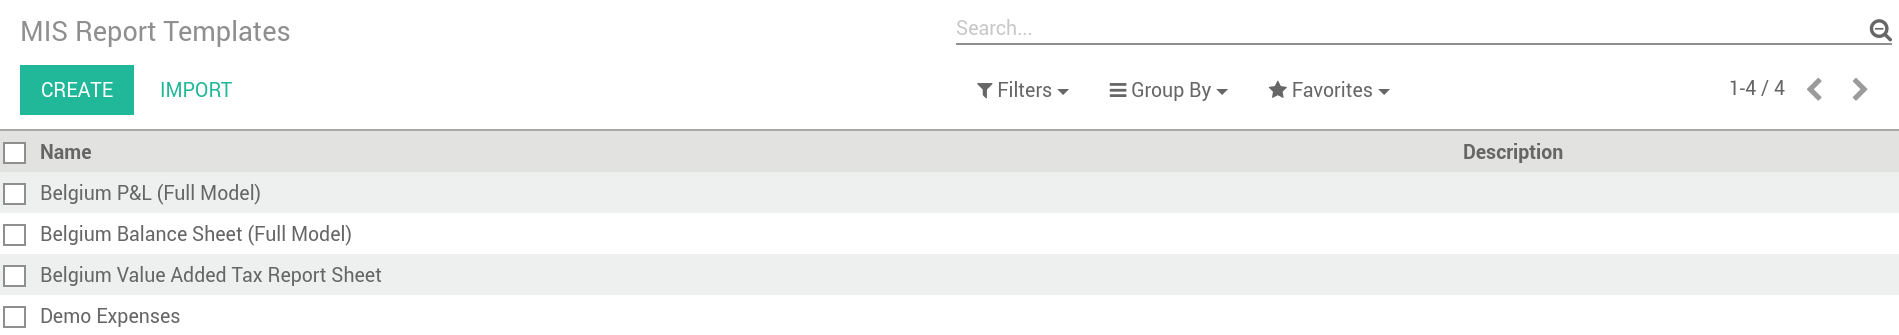
MIS Report Templates
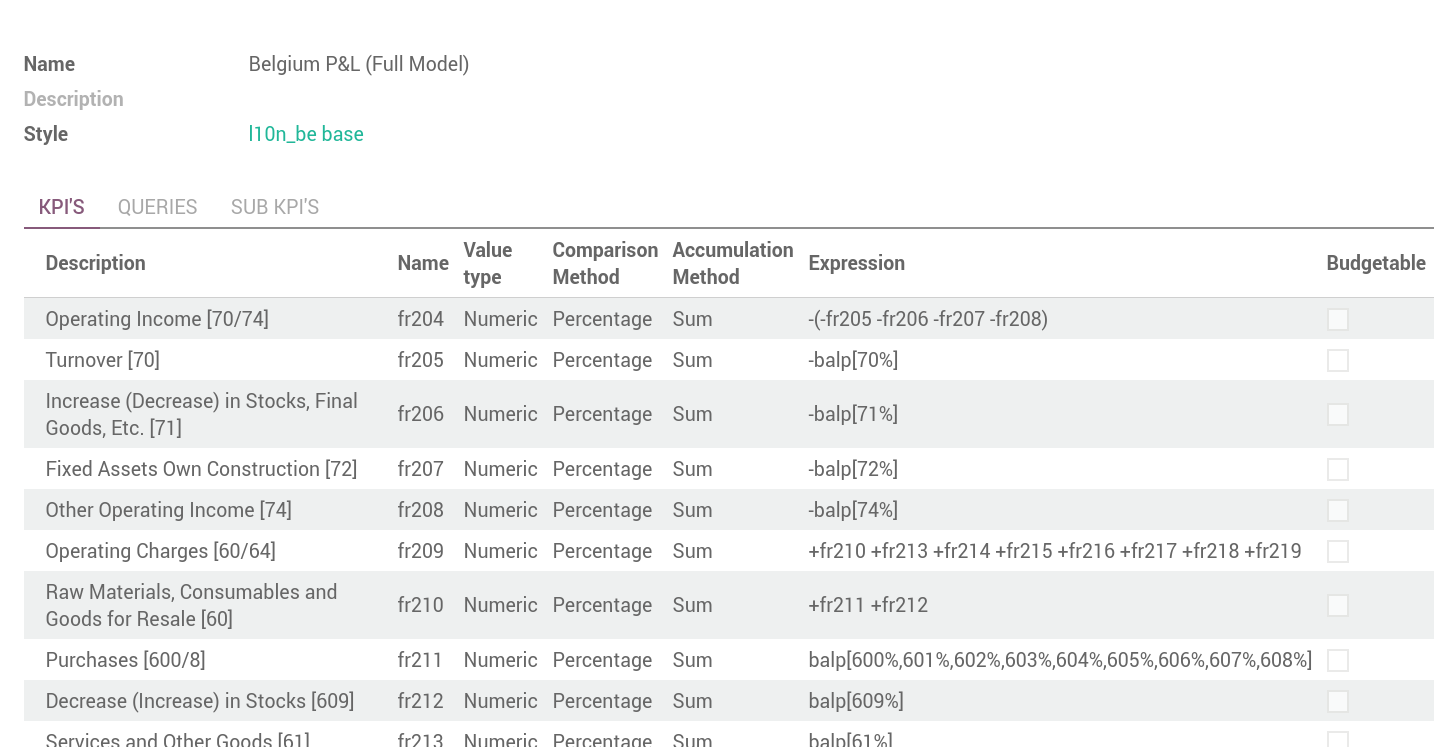
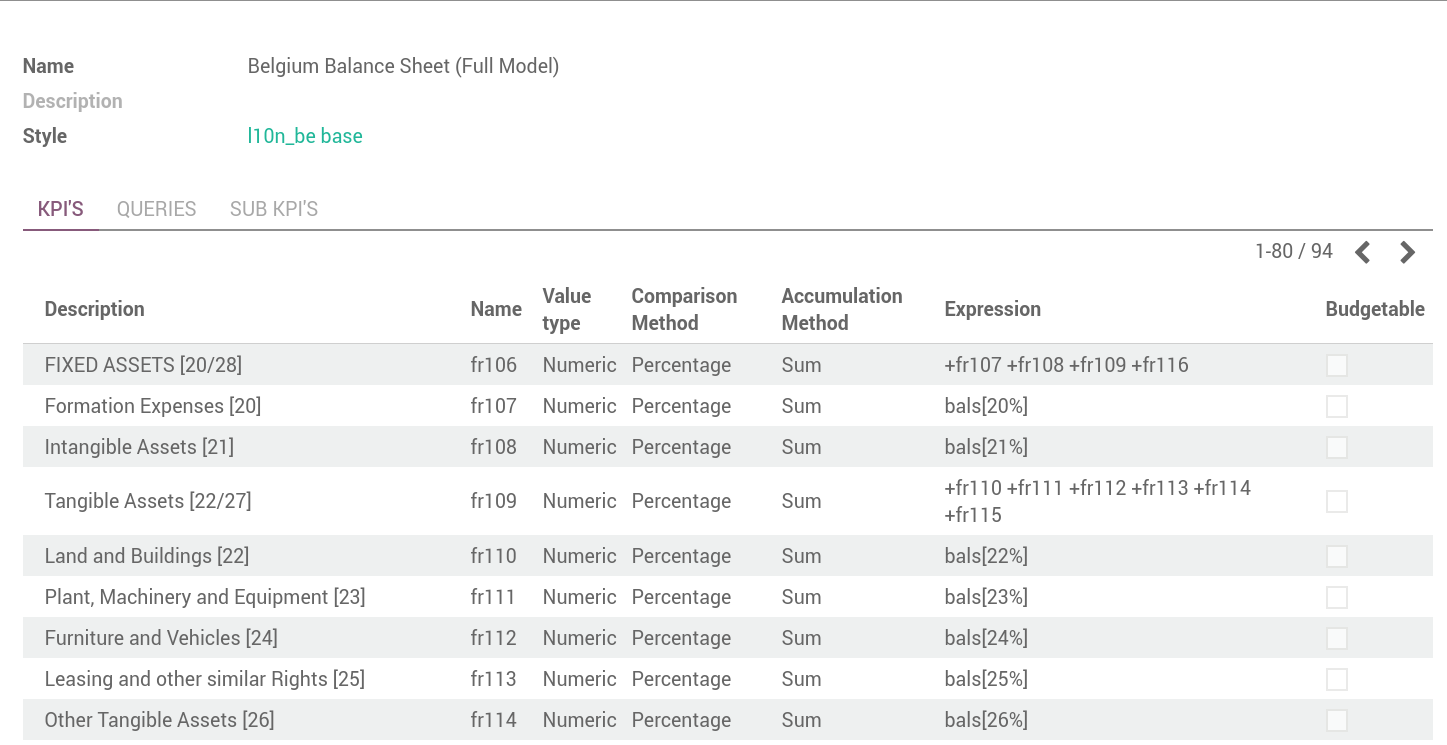
Go to Accounting > Configuration > Financial Reports > MIS Report Templates where you can create report templates by defining KPI’s. KPI’s constitute the rows of your reports. Such report templates are time independent.
MIS Report
Then in Accounting > Reporting > MIS Reports you can create report instance by binding the templates to time period, hence defining the columns of your reports.
Quick start: building a simple P&L report
Create a Template Report
Menu accessible here: Accounting > Configuration > MIS Reporting > MIS Reports Template
Templates are the base of the reports, defining the KPI structure and calculation between the elements. They can be found in:
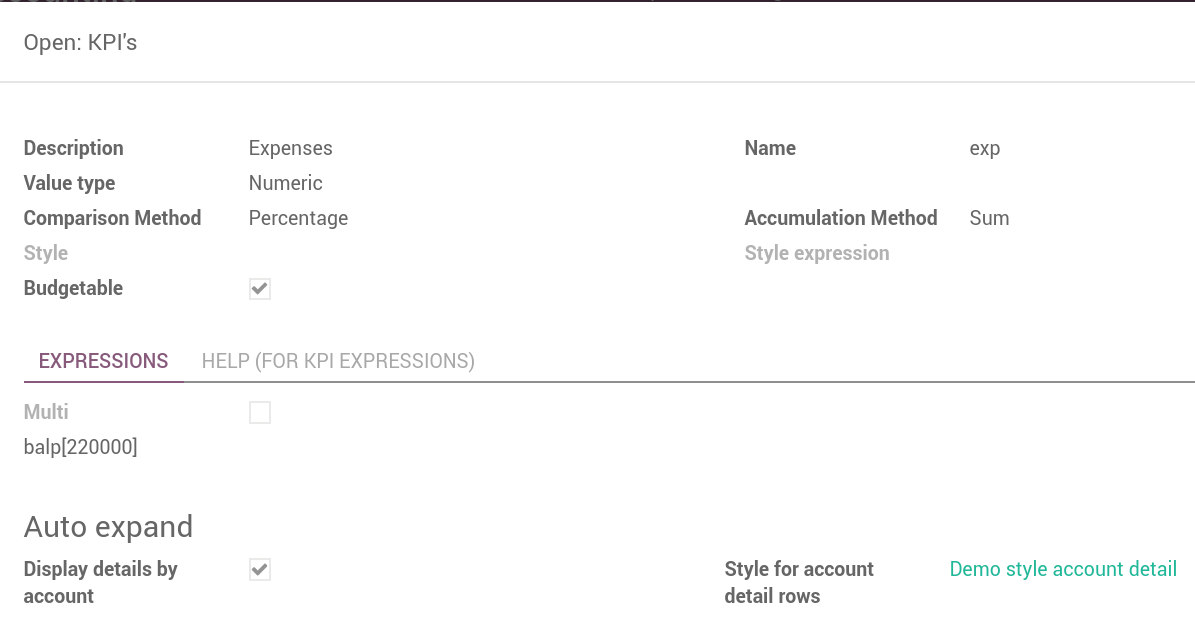
How to create a template
- Provide a Description (Name is automatically proposed but can be amended)
- Value type (Numeric, percentage or string)
- Comparison Method (Percentage, difference, none)
- Style: as defined in the Reports Style
- Style expression: An expression that returns a style depending on the KPI value. Such style is applied on top of the row style. Example of syntax: “Style_to_be_used” if name>0 else None
- Budgetable (if MIS_Budget module is installed): indicates that a budget can be provided for the KPI (not needed for calculations)
- Multi: If True allows to define KPI with multiple values (eg: Initial, Debit, Credit, Ending) using Sub-KPI
- Expression: calculation for the KPI (see below)
- Display details by account: If set to true will display account details
- Style for account detail rows: specific style applied to the detailed accounts.
Adding KPI to the current report
KPI are the different element that constitutes the template:
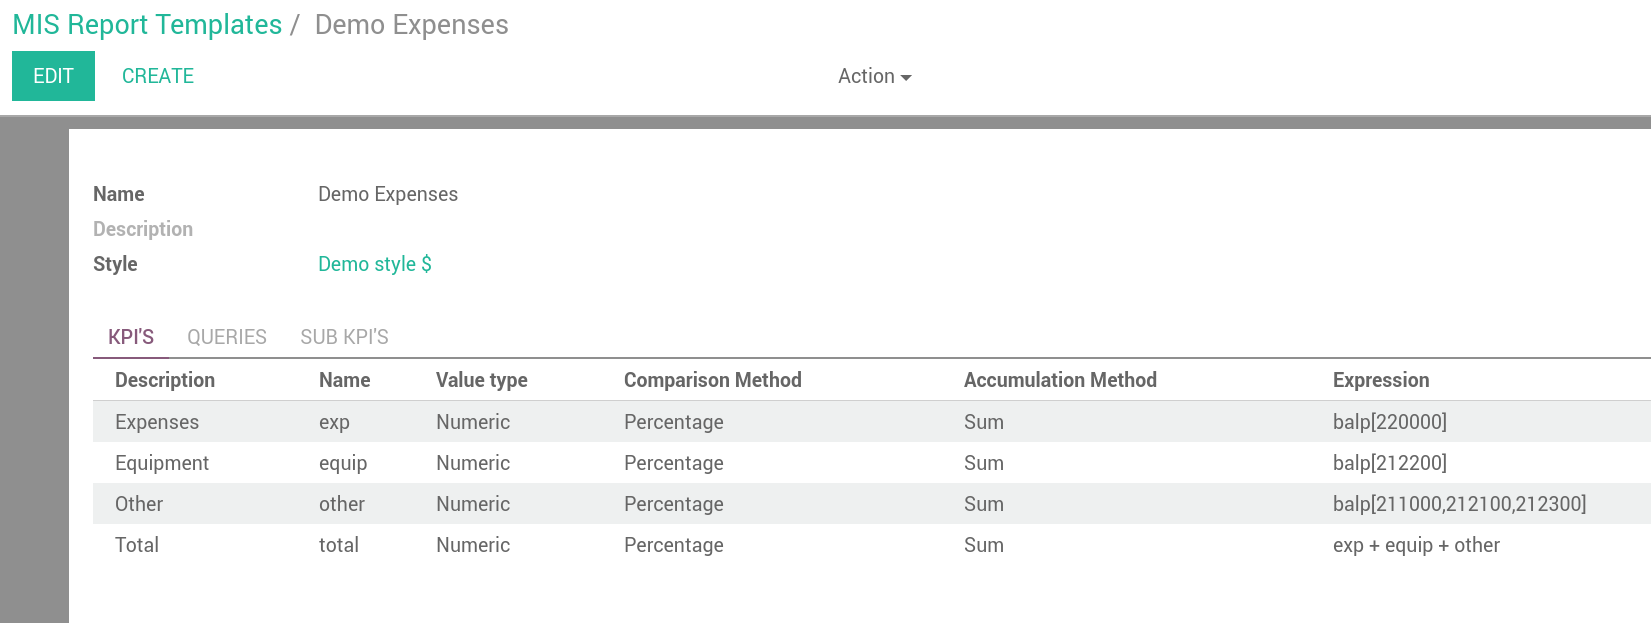
KPI details:
Use the Template to create a new Report
Menu accessible here: Accounting > Reports > MIS Reporting > MIS Reports
Once templates are created, you can use them to display the data for specific series and dates in order to display the data, compare them and calculate additional series:
You can create a new report with different series based on the selected template.
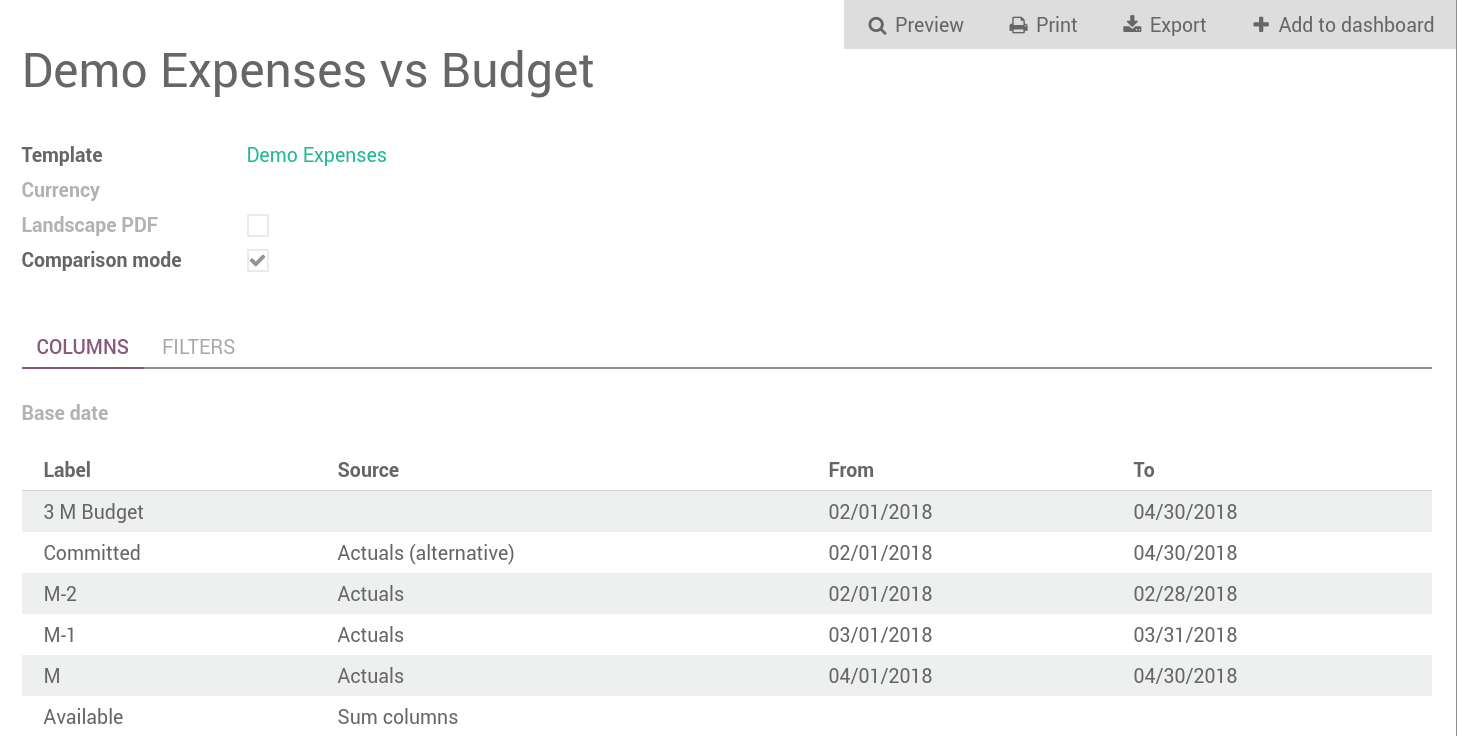
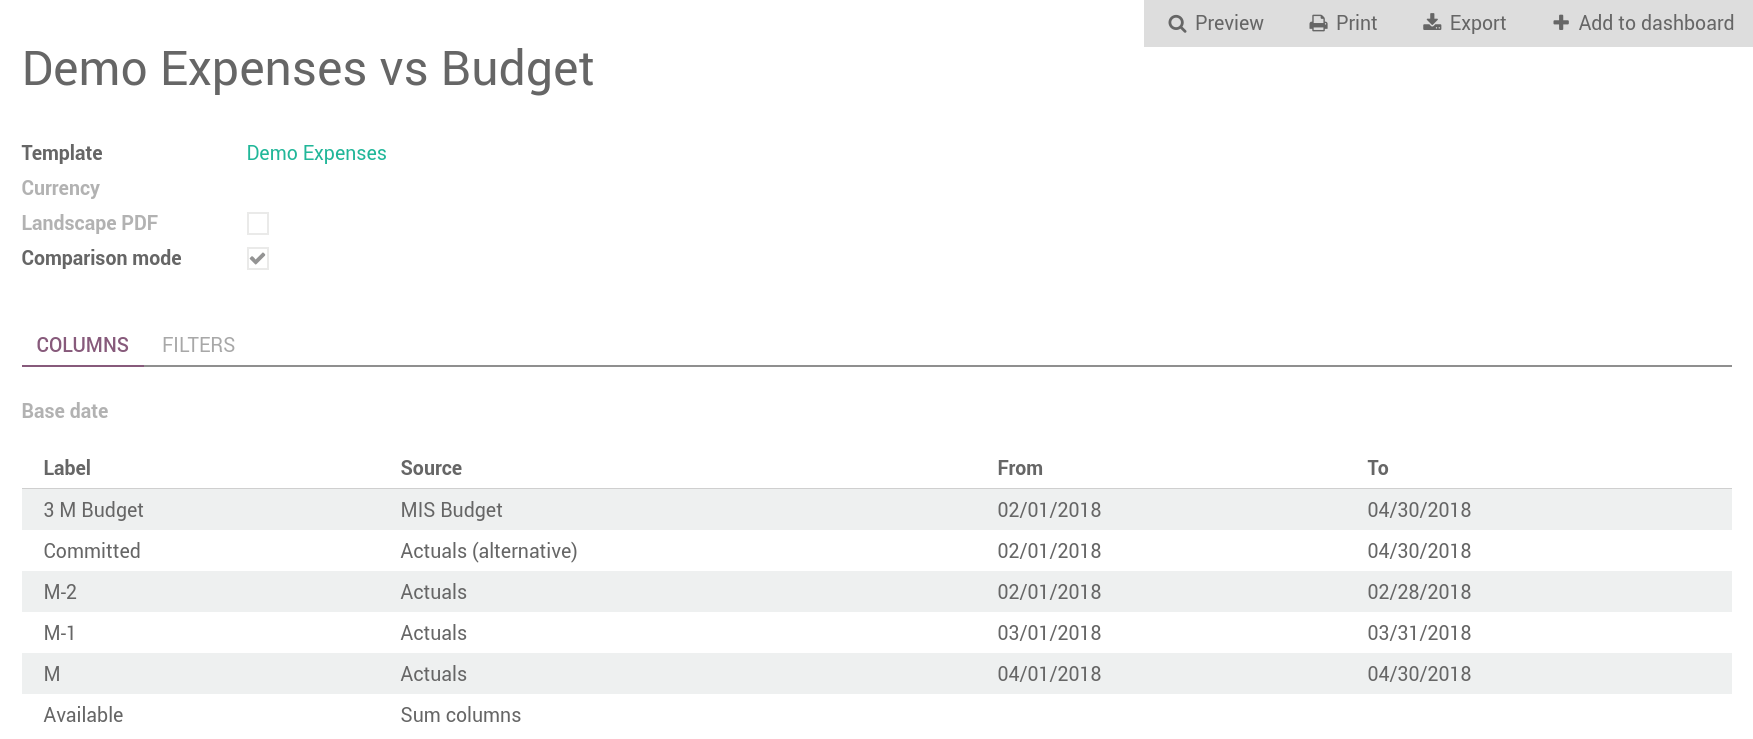
Create a report
- Provide a Name
- Select the Template
- Select the currency
- Comparison mode: set to true if you wish to be able to compare data from different series or dates.
- Set your filters: Posted entries or not
- Base date: important for relative date reports (today by default)
- Add Columns to your report (if comparison is True)
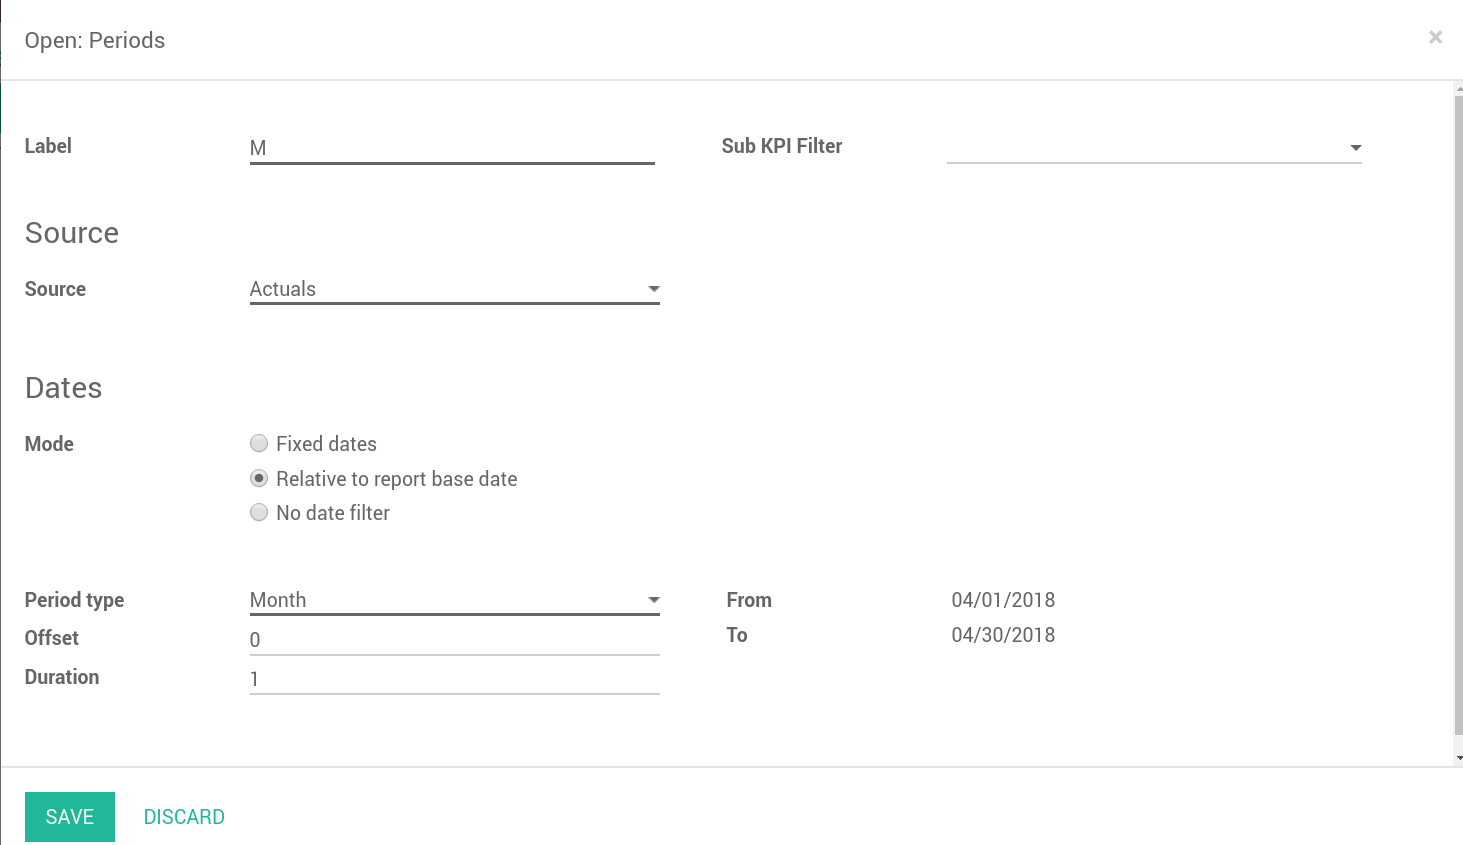
Create a new column in the report
- Set the label to appear on top of the column as title
- Select sub-KPI filter if necessary
- Select the source of the data:
- Actual: use data from accounting move lines.
- Actual (Alternative): Use a custom-made series (not accounting moves) with at least following fields: initial, debit, credit, ending, dates
- Sum Columns: Creates a new column sum of others existing in the report
- Compare Columns: Creates a comparison (percentage) of 2 existing columns
- MIS Budget (If budget installed): Use Budget Series
- Dates Mode:
- Fixed Dates: simply provide the fixed range
- Relative to report base date: allows to select the period compared with base report date.
- Offset = -1 means previous month.
- Duration = 2 means 2 months from the start of the period
Instances example, column types
Todo
content waiting contribution
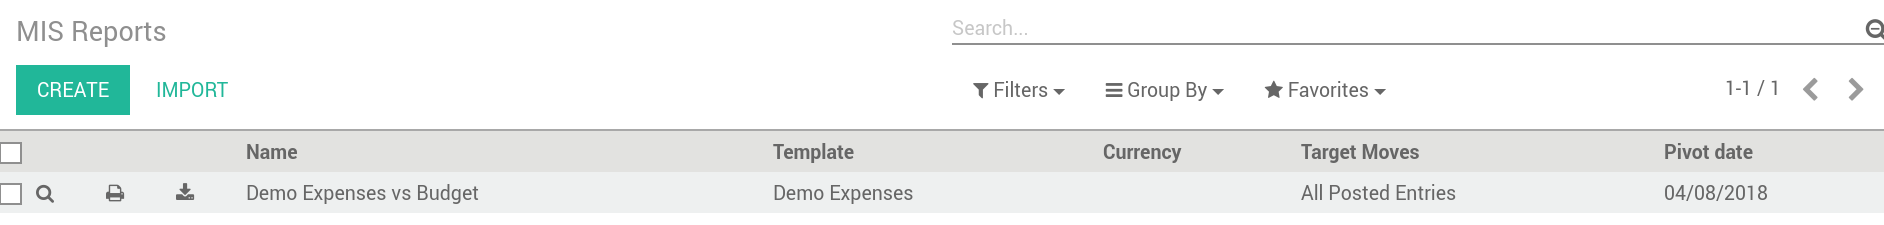
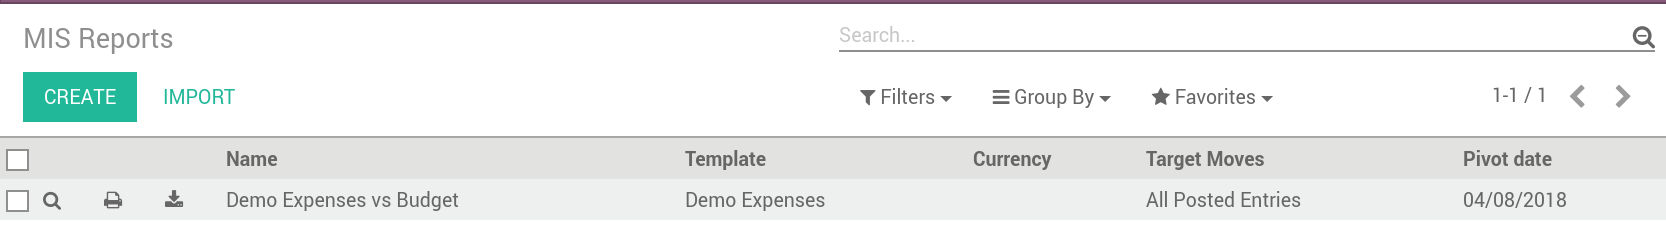
Displaying reports
Menu accessible here: Accounting > Reports > MIS Reports > MIS Reports
Reports can be displayed from the tree or the Form view:
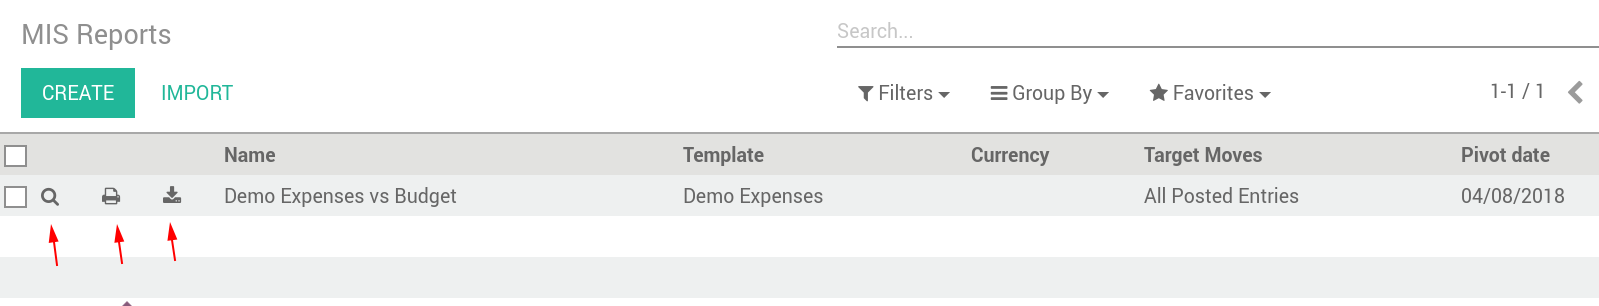
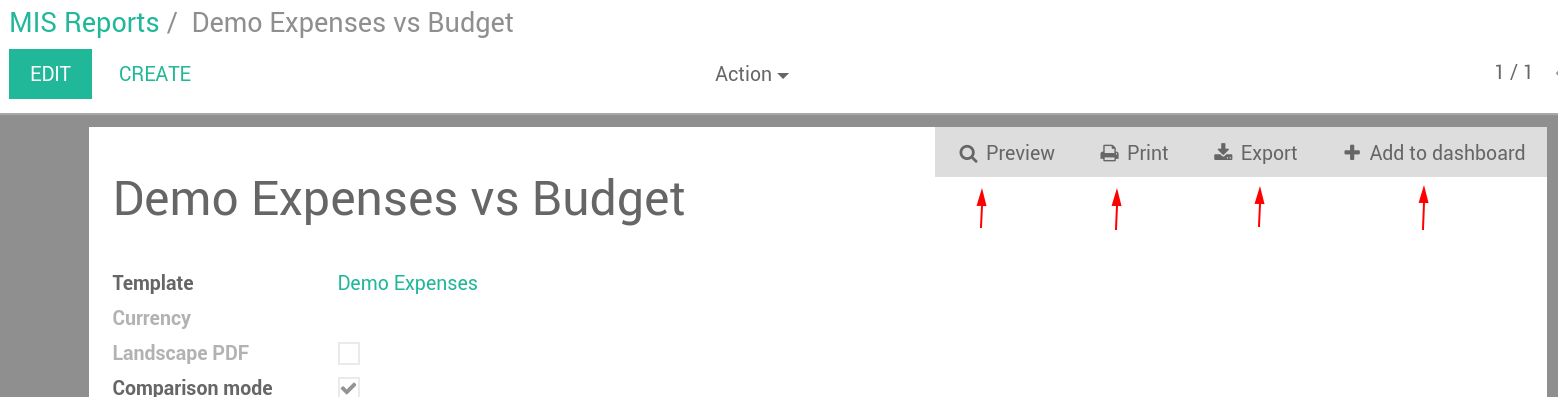
They can either be (in order of the button):
- Displayed directly in the web interface
- Exported as PDF file
- Exported as Excel File
- Added to a standard Odoo Dashboard
Note
When the report is displayed in the web interface user can click on any figure and drill down to the underlying data.
KPI or Accounting Expressions
Building your KPI
Expressions can be any valid python expressions.
The following special elements are recognized in the expressions to compute accounting data: {bal|crd|deb}{pieu}[account selector][journal items domain].
- bal, crd, deb: balance, debit, credit.
- p, i, e: respectively variation over the period, initial balance, ending balance
- The account selector is a like expression on the account code (eg 70%, etc).
- The journal items domain is an Odoo domain filter on journal items.
- balu[]: (u for unallocated) is a special expression that shows the unallocated profit/loss of previous fiscal years.
- Expression can also involve other KPI and query results by name (eg kpi1 + kpi2).
Additionally following variables are available in the evaluation context:
- sum, min, max, len, avg: behave as expected, very similar to the python builtins.
- datetime, datetime, dateutil: the python modules.
- date_from, date_to: beginning and end date of the period.
- AccountingNone: a null value that behaves as 0 in arithmetic operations.
Examples
- bal[70]: variation of the balance of account 70 over the period (it is the same as balp[70].
- bali[70,60]: initial balance of accounts 70 and 60.
- bale[1%]: balance of accounts starting with 1 at end of period.
- crdp[40%]: sum of all credits on accounts starting with 40 during the period.
- debp[55%][(‘journal_id.code’, ‘=’, ‘BNK1’)]: sum of all debits on accounts 55 and journal BNK1 during the period.
- balp[(‘user_type_id’, ‘=’, ref(‘account.data_account_type_receivable’).id)][]: variation of the balance of all receivable accounts over the period.
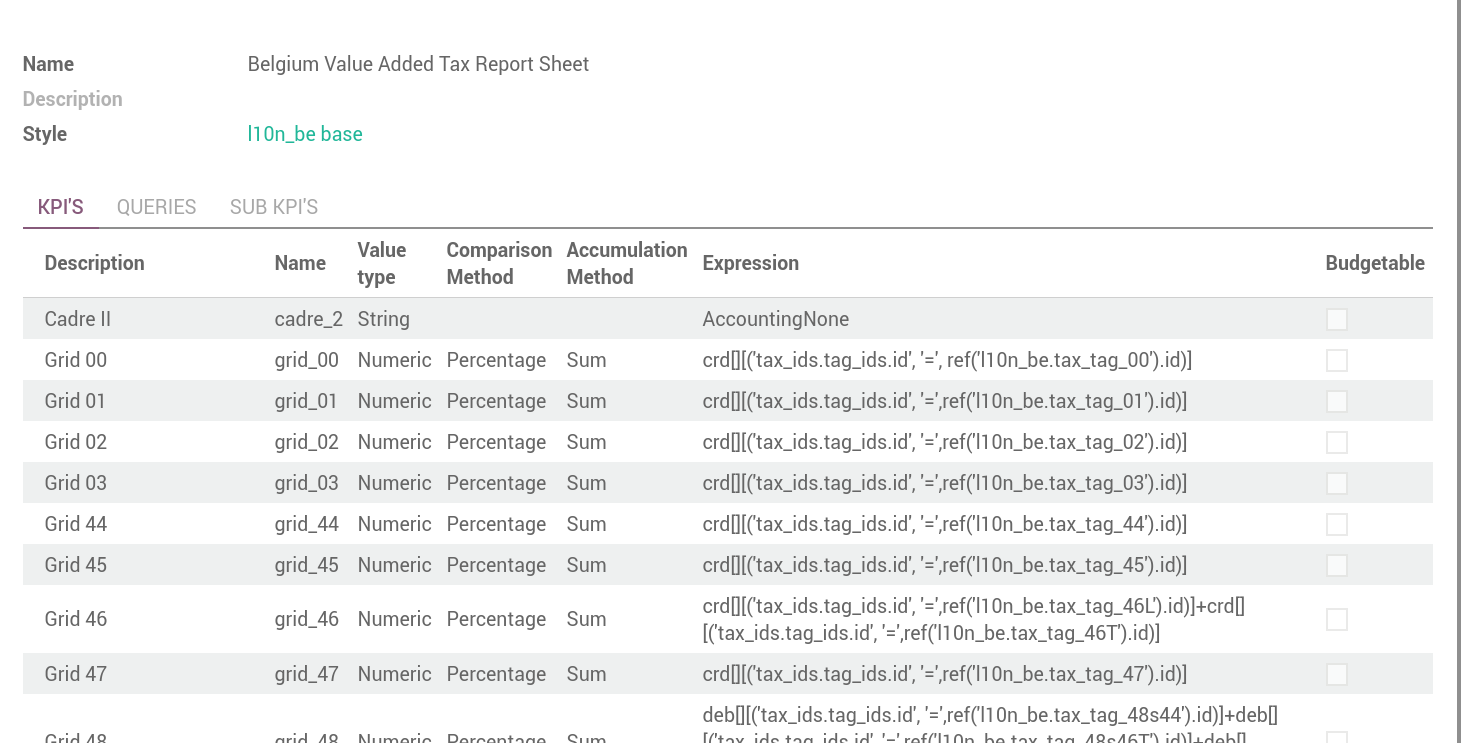
- balp[][(‘tax_line_id.tag_ids’, ‘=’, ref(‘l10n_be.tax_tag_56’).id)]: balance of move lines related to tax grid 56.
Expansion of Account Detail
Todo
content waiting contribution
Python expressions basics
Arithmetic Expressions
Todo
content waiting contribution
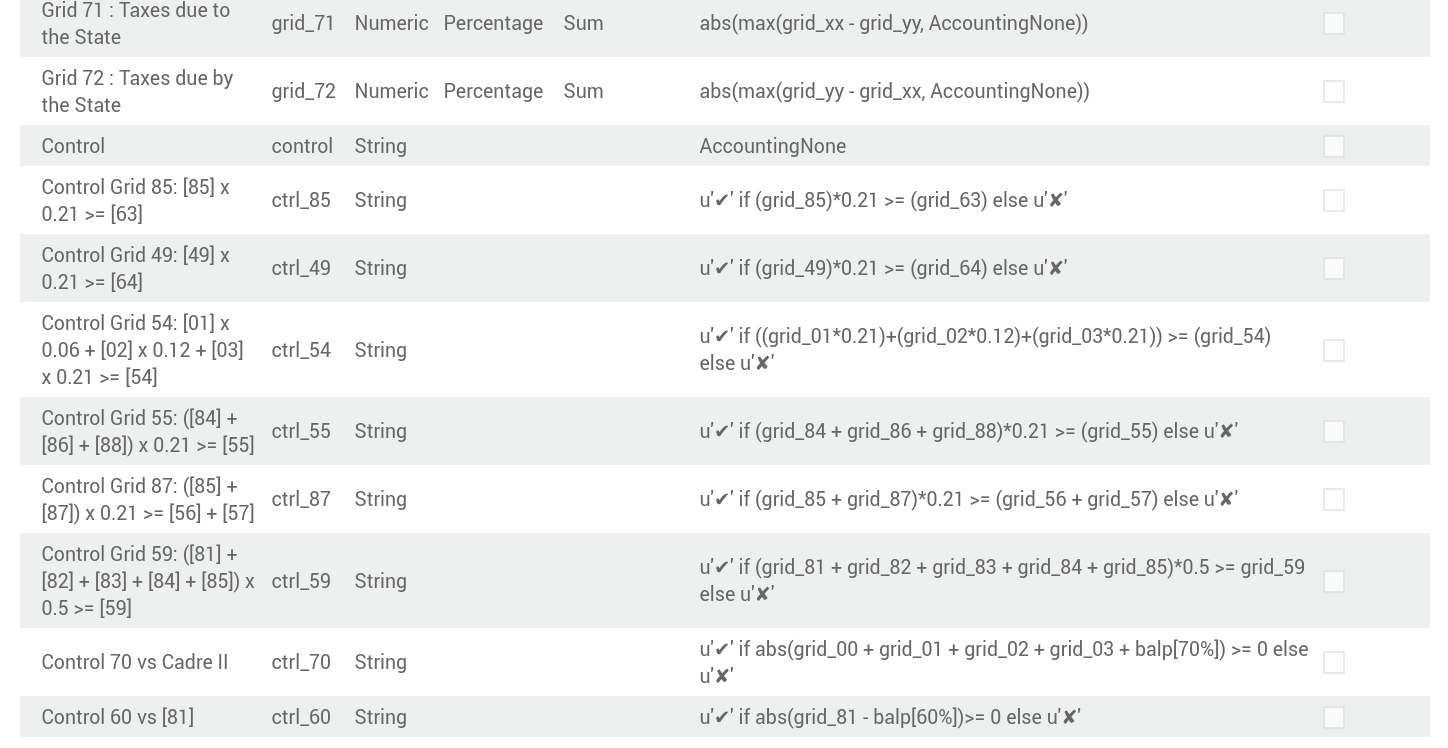
Conditional Expressions
Todo
content waiting contribution
Zero vs no data, AccountingNone
Todo
content waiting contribution
Reporting on non-accounting data (queries)
This section describes the “Queries” tab in the MIS Report definition form. It is used to prepare queries on any Odoo model that has at least a date-like field, and use the result in expression.
Note
See also the Data sources for columns section to report on views that are similar to journal entries, such committed purchases.
Example of query: we want a report showing the Total amount (Excluding VAT) of all sales order confirmed during the current month and the previous month.
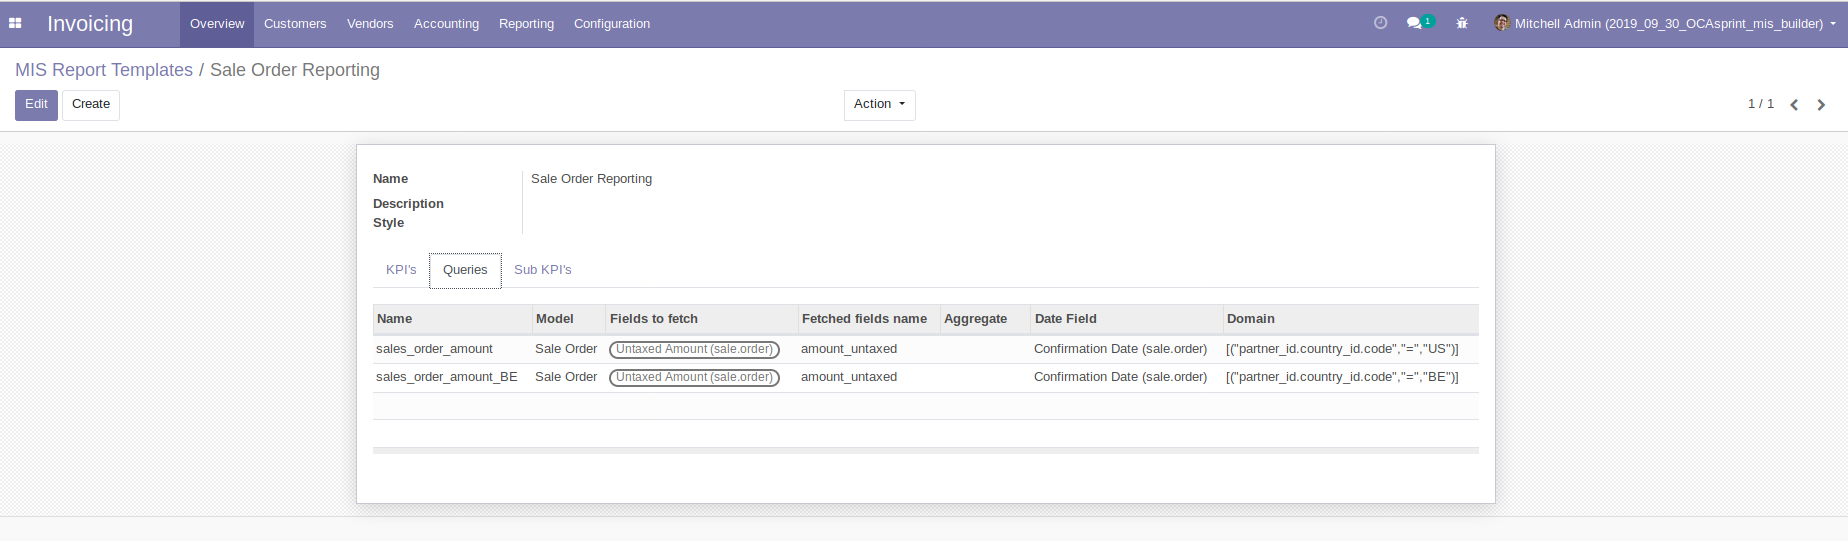
To create a query, first populate the Queries tab.
- Name
- Select a name (it must be a compatible with a python variable name, so no space in the name for instance, use only ascii letters, digits and underscore, and start with a letter)
- Model
- Look for the model on which you want to do the report. For example : Sale Order
- Field to fetch
- Select in the list the field from the Model that will be used in the report. For example: Untaxed Amount
- Fetched fields name
- This will show the name of the field to use in the KPI expression later on. For example: amount_untaxed
- Aggregate
- Choose between nothing, Sum, Max, Average or Min. If you leave this aggregate field empty, the query will give a list, not a number.
- Date field
- Choose a date field available on the Model. This date is used to get the records that matched the period mentioned in the query. For example: confirmation date of the sale order.
- Domain
- This is optional. Use a domain (as definded in classic Odoo), to filter records. For example: [(“partner_id.country_id.code”,”=”,”US”)]
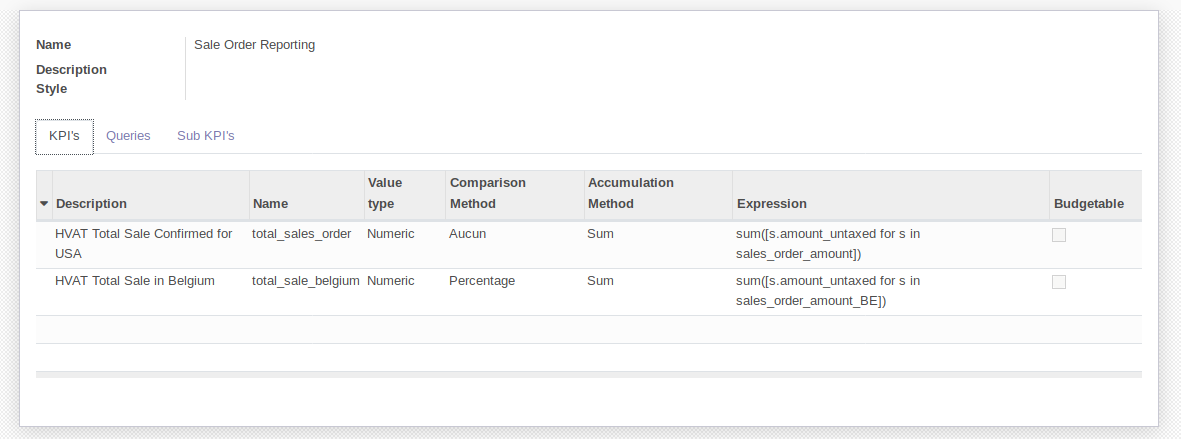
In the KPI expression, you can now use the fields of the queries.
For example: sum([s.amount_untaxed for s in sales_order_amount]) in case
the Aggregate field was not set, or s.amount_untaxed in case the Aggregate
field was set.
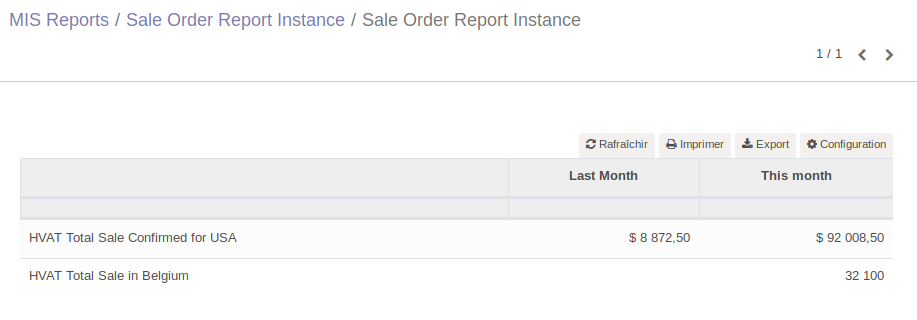
In a reporting instance, the result is as follows:
Styles
Menu accessible here: Accounting > Configuration > MIS Reporting > MIS Reports Style
You can create multi-level styles which will be applied to the different lines of reporting:
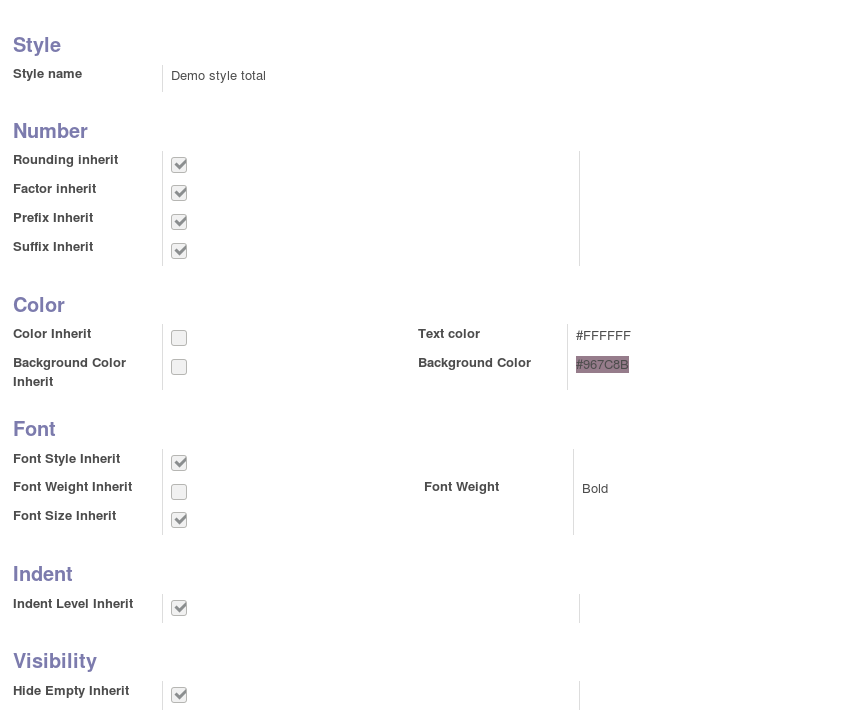
The styles are used later in the Template Report definition.
Todo
Add a line for each of the options, although they are quite straightforward.
Analytic Filters
Analytic accounts is often used in budget and actual versions to follow-up the costs and expenses of a project.
If you need to activate the management of analytic accounts, go to Invoicing module ‣ Configuration ‣ Settings and enable the Analytic Accounting.
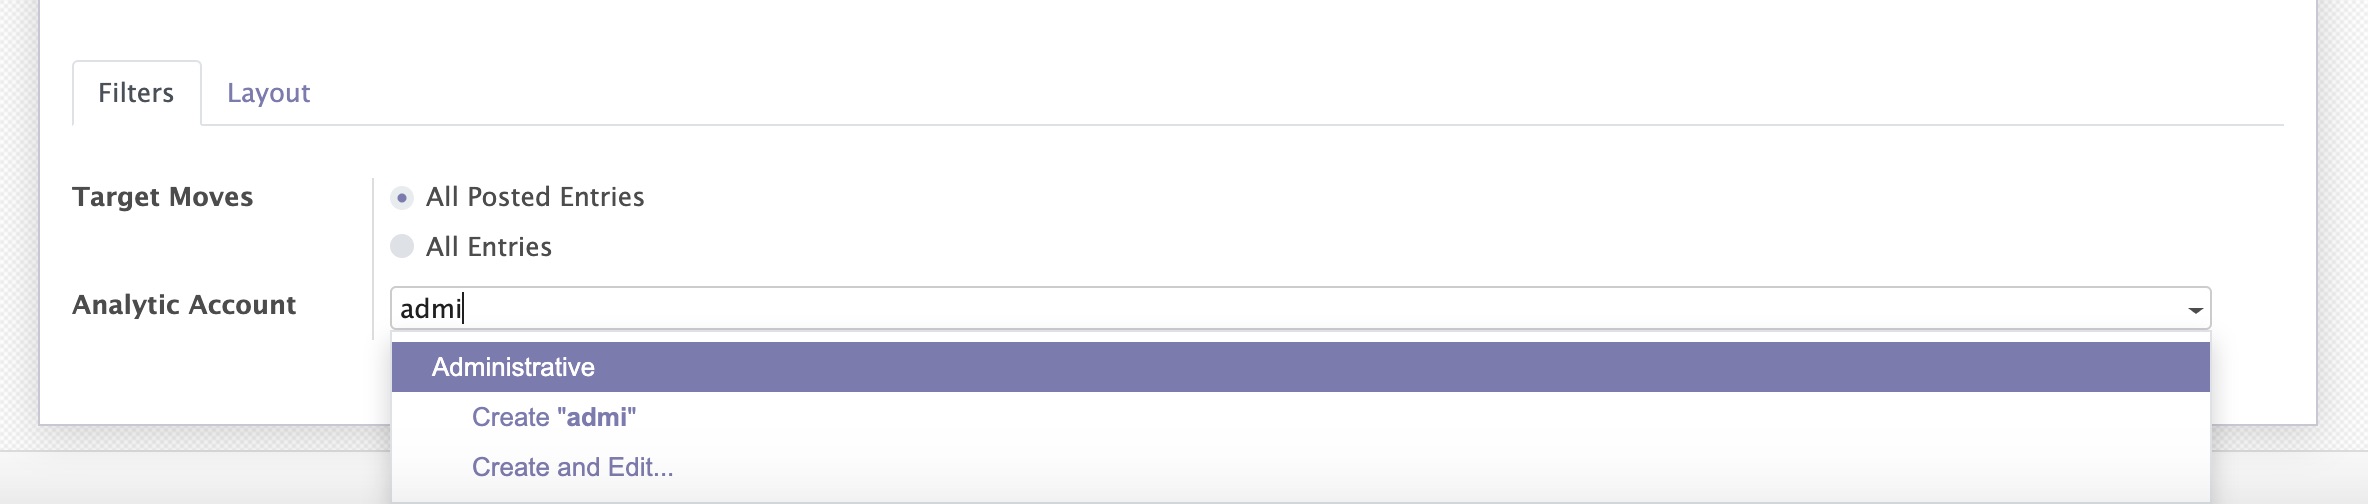
In each MIS report, you can untick the box to get the analytic filters. The selection possible is one only.
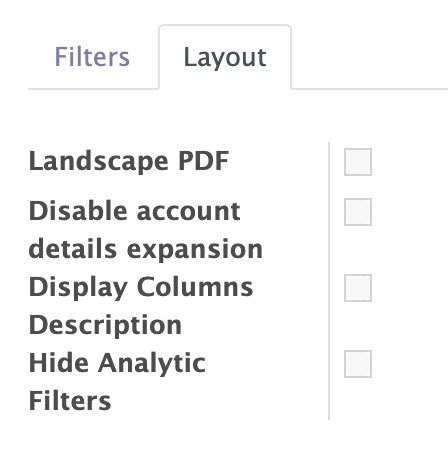
The other possibility is to add the analytic filter in the MIS report without any selection possible by the user of the report.
Data sources for columns
- Actuals
- Actuals (alternative): Check the module
mis_builder_demoto see how to create specific series of data for Committed purchases not yet invoiced. - Sum/Difference
- MIS Budgets
Todo
content waiting contribution
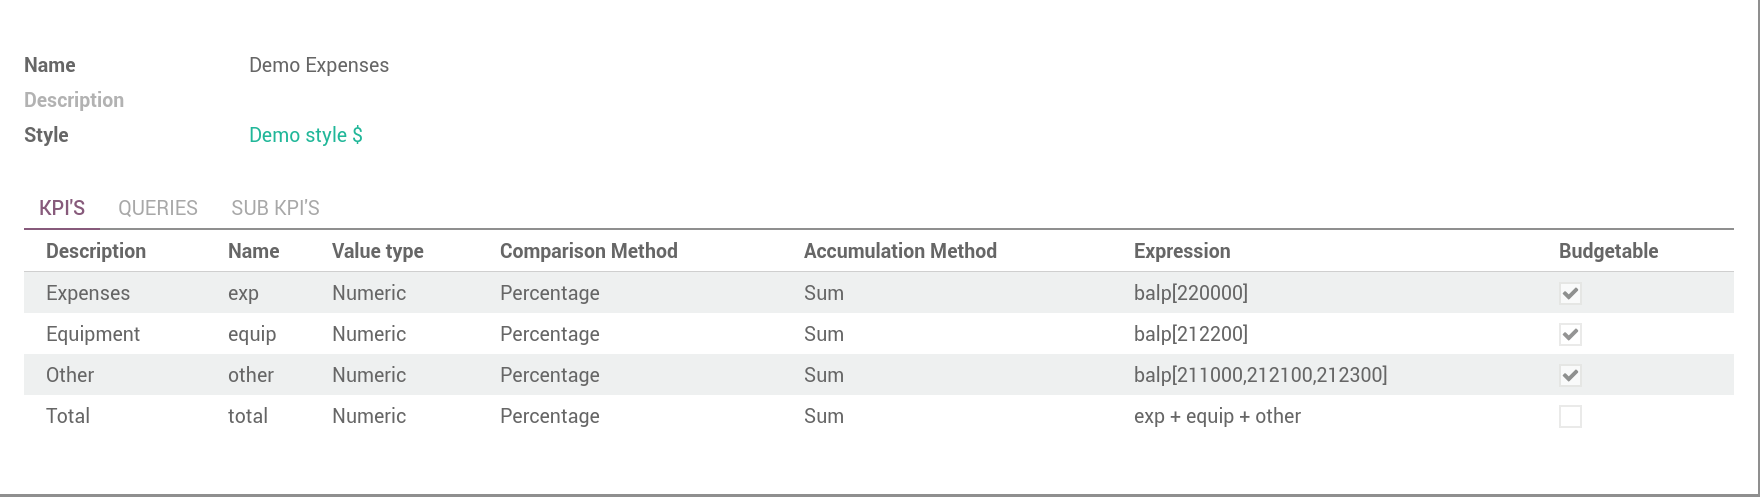
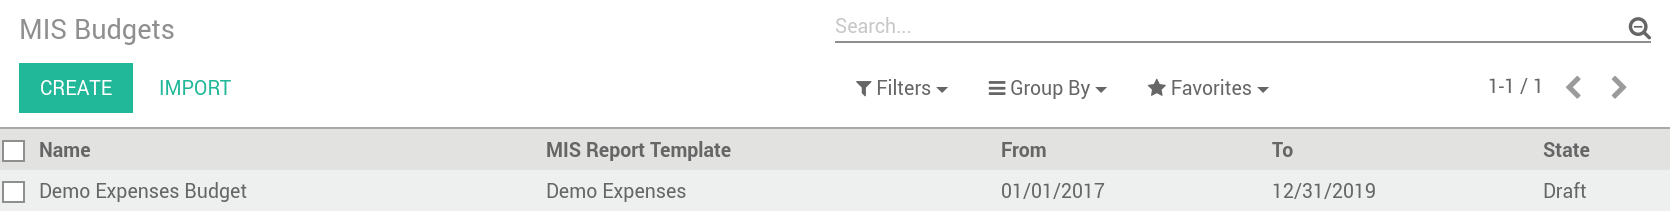
MIS Budgets
Menu accessible here: Accounting > Reports > MIS Reports > MIS Budget
This module lets you create budgets for any MIS report. Several budgets can be created for a given report template (ie one budget per year). Budget figures are provided at the KPI level, with different time periods. A budget can then be selected as a data source for a MIS report column, and the report will show the budgeted values for each KPI, adjusted for the period of the column.

To use this module, you first need to flag at least one KPI in a MIS Report to be budgetable. You also need to configure the accumulation method on the KPI according to their type.
The accumulation method determines how budgeted values spanning over a time period are transformed to match the reporting period.
- Sum: values of shorter period are added, values of longest or partially overlapping periods are adjusted pro-rata temporis (eg monetary amount such as revenue).
- Average: values of included period are averaged with a pro-rata temporis weight. Typically used for values that do not accumulate over time (eg a number of employees).
When KPI are configured, you need to:
- Create a budget, then
- Click on the budget items button to create or import the budgeted amounts for all your KPI and time periods.
- Finally, a column (aka period) must be added to a MIS report instance, selecting your newly created budget as a data source.
- The data will be adjusted to the reporting period when displayed.
- Columns can be compared by adding a column of type “comparison” or “sum”.
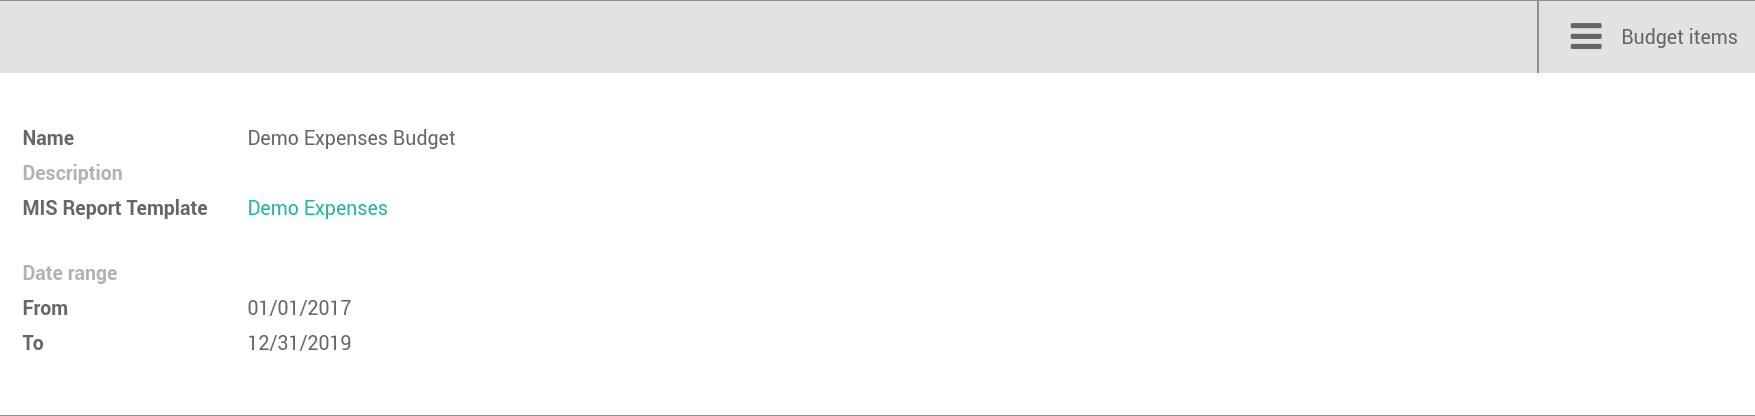
Create a new budget
A budget is linked to a set of KPI created in the Report Template. A budget must be defined for a specific period (year or month)
- Provide a Name and Description
- Provide the Template it applies to
- Provide the date range. This is important because if a year is given, when the report must display 3 months, current figures will be provided prorata temporis.
- Save and provide the budget Items
Fill in your Budget items
A budget contains “Budget items” (smart button on top right) which are the budget values for a KPI and a specific data.
- Select the KPI to be budgeted
- Select the date range or From/To
- provide Amount in Company currency
- Provide the corresponding Analytic account
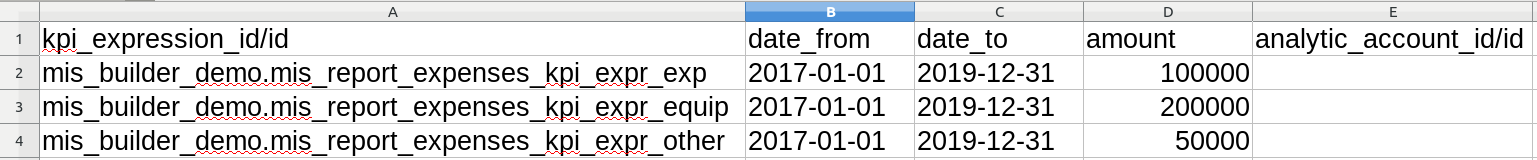
Note
To be noted that the budget could be prepared in Excel and easily imported via Odoo Standard Function.
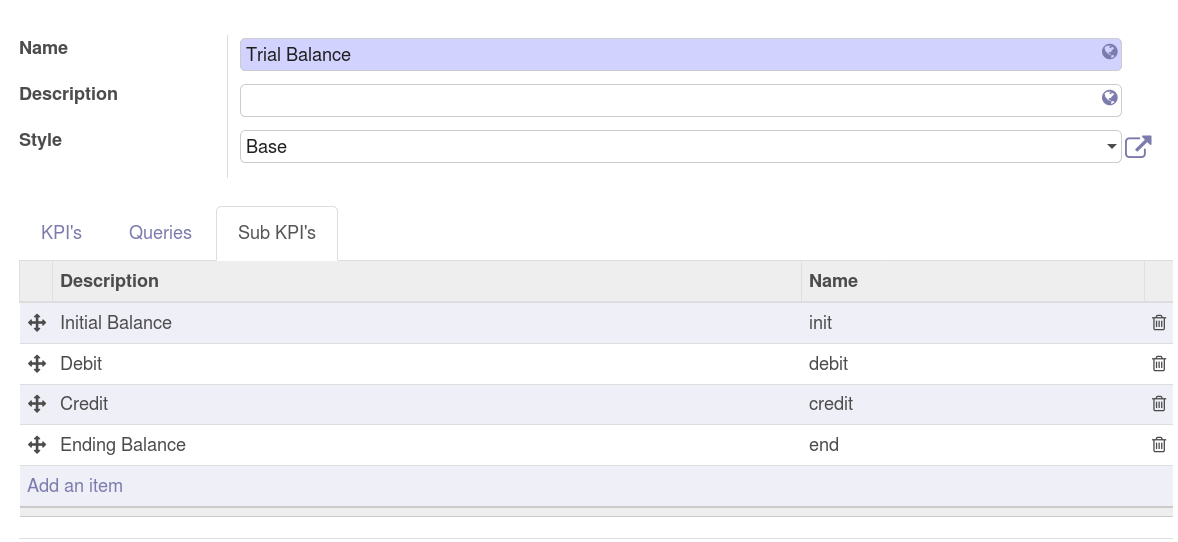
Sub KPI
Used when the field Multi is set to true for multiple KPI. Thanks to this option, one given KPI can display multiple columns (eg: Initial balance, Debit, Credit and Ending Balance).
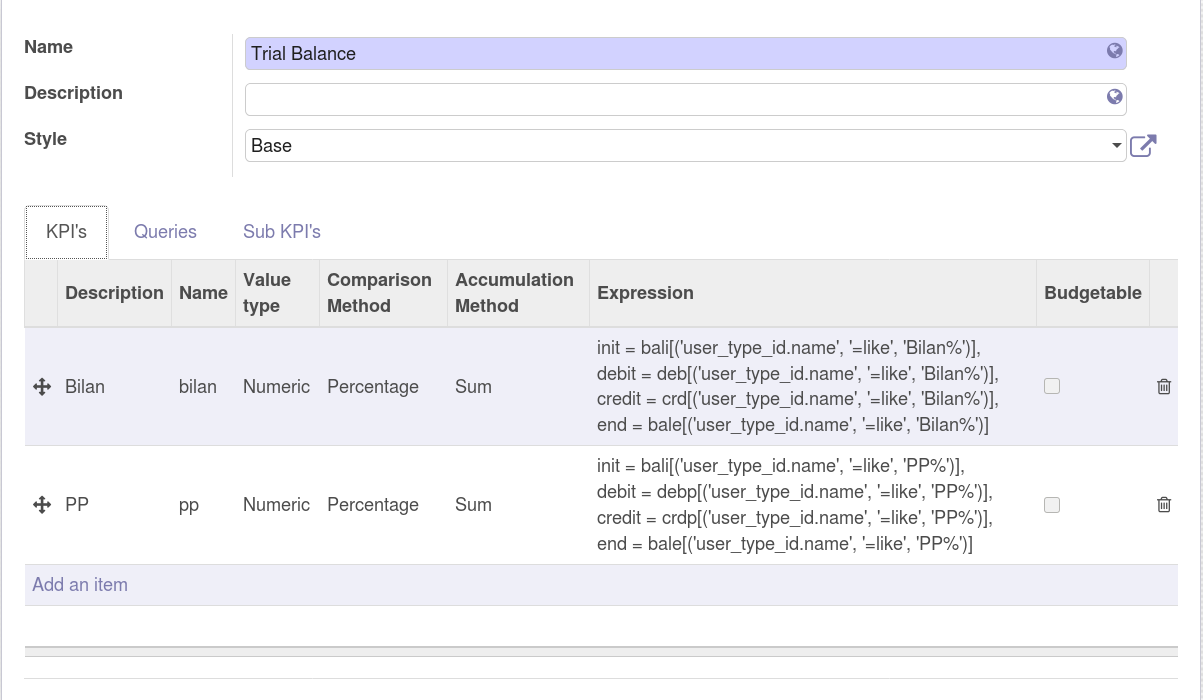
Example building a trial balance with initial, debit, credit, ending balance over several periods
Building your own reports
The module mis_builder_demo provides multiple example along with the current existing localizations